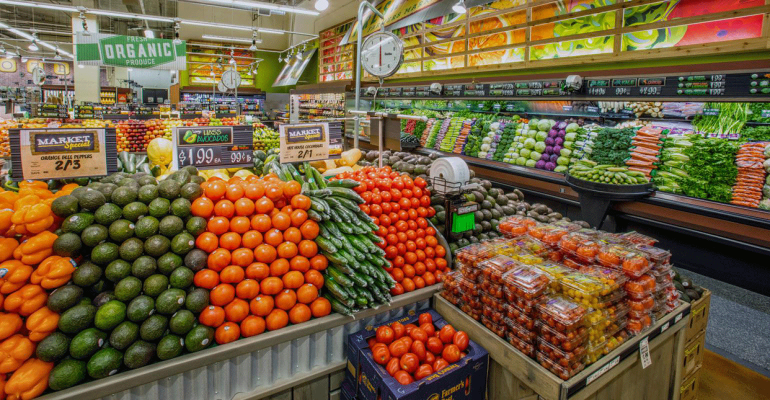
Fresh categories are the primary driver of U.S. dollar sales growth in fast-moving consumer goods (FMCG), according to market research firm Nielsen.
And of dollar sales growth across the FMCG arena, e-commerce channels are responsible for the vast majority of gains — though food and beverage sales remain a small but burgeoning online segment, Nielsen said in its June 2018 Total Consumer Report.
Fresh and perishable foods accounted for 49% of all dollar sales growth in the FMCG brick-and-mortar space in the previous 52 weeks, the report said. Overall, fresh categories tallied in-store sales of nearly $178 billion for the period, almost 14 times more than the $13 billion generated by online food and beverage sales.
That makes fresh a more immediate growth opportunity for retailers than e-commerce, the study said. With many fresh ingredients being a starting point for energizing categories across packaged foods and nonfoods — and with consumers shopping needs rather than departments — taking a broader view of the sales floor can eliminate “blind spots” to opportunities in fresh, Nielsen noted. The report introduced Nielsen’s Total Food View, designed to help companies seize potential opportunities across bakery, deli, produce, seafood and meat departments.
"Fresh plays a crucial role in driving consumer traffic and loyalty," John Tavolieri, president of U.S. FMCG and retail and chief technology and operations officer at Nielsen, said in a statement. "To win shoppers over, fresh has to be integral to a broader, more connected total store approach that goes beyond category management.”
For example, broadening the landscape of prepared foods for meal solutions boosts the sales potential for retailers, according to Nielsen. Prepared foods in the deli represents $10.9 billion in sales but swells to $43.4 billion when including prepared items in the center store, such as in frozen, dairy and grocery. Incorporating adjacent categories expands that opportunity even more, to a $62.6 billion sales opportunity.
“With the popularity of items like rotisserie chicken or pizza, the prepared foods umbrella broadens even further when incorporating adjacent categories. Extending scope across the store brings new meaning to the ideals of making a meal at home,” Nielsen explained in the report.
The overall FMCG market totaled sales of $1.054 trillion for the 52-week period, up 3.47% year over year. But of that growth, e-commerce accounted for 82% versus 18% for brick-and-mortar retail, the report said.
Eighty-seven percent of the e-commerce growth encompassed sales of nonfood items. “Notably, e-commerce isn’t yet as significant for food and beverage. In fact, food and beverage sales represent just 13% of the overall dollar volume we’ve seen online in the past year,” Nielsen said. “While there’s never been a more important time to go digital, the trends in food and beverage indicate that there may be some untapped opportunities closer to home for FMCG edibles.”
For brick-and-mortar retail, FMCG dollar sales edged up 0.7% to $789 billion for the 52 weeks, while unit sales dipped 0.9% to 250.9 billion.
“This highlights a fundamental shift across the FMCG brick-and-mortar landscape, where consumers are buying fewer products, irrespective of the impact of monetary factors like inflation or pricing in many cases,” the study said.
Fresh perishables contributed $2.2 billion in dollar growth versus $2.9 billion for center-store edibles. Nonedibles saw a $600 million decline.
“But center-of-store-categories throughout frozen, dairy and grocery aisles account for nearly two times the dollars spent across all fresh departments,” Nielsen pointed out in the report. “So, relative to their overall size, fresh categories are driving outsized growth.”
At the perimeter of the store, deli led with dollar sales growth of 2.8% and unit volume growth of 3.4%, followed by bakery (+1.2% in dollars, +2.4% in units), meat (1.5% in dollars, +0.1% in units), seafood (+1.5% in dollars, -1.3% in units) and produce (+0.3% in dollars, -2.9% in units).
“In the last year, the perimeter has been bolstered by strong performance across the board, but particularly among deli and meat sections of the store. Rising prices have stimulated inflationary growth for meat sales,” the report said. “Looking more granularly, the deli department shines as a true growth engine for the store, having posted dollar growth of over $875 million and an increase of over 240 million in units in the last year.”
Among food trends, Nielsen reported that on-the-go fresh produce isn’t catching on as well as “clean” snacking. Pre-cut produce portioned for snacking purposes fell nearly 2% in dollars and 6% in unit sales over the last year.
“Although Americans would rank eating more fruits and vegetables as the top factor for healthy eating, they're not flocking to on-the-go fresh produce offerings as much as they are to other snack options,” the market researcher said. “On the flip side, salty snacks are proof that consumers are seeking indulgence in their snacking purchases too, as sales grew nearly $1 billion year-over-year.”
Health-conscious consumers can still see indulgences as "clean," as clean-label products represented 35% of salty snack dollars in the past year, Nielsen said. “Retailers and manufacturers that can demonstrate transparency through their labeling can capitalize on the wave of consumer interest around ‘responsible’ snacking. Consumers do have a sweet tooth, but the best way to capitalize on it is through the sweet spot of appealing to the smart snackers of today.”


